
Key Takeaways
- New maps reveal complex changes in global artificial light levels from 2014 to 2022, showing both brightening and dimming in various regions.
- NASA’s Black Marble data highlights a 34% global increase in radiance, influenced by factors such as urban growth in China and energy-efficient lighting in Europe.
- Dimming areas, especially in Europe, correlate with energy crises and conservation measures, including a 33% reduction in light pollution in France.
Illuminated Changes in Global Nighttime Lights
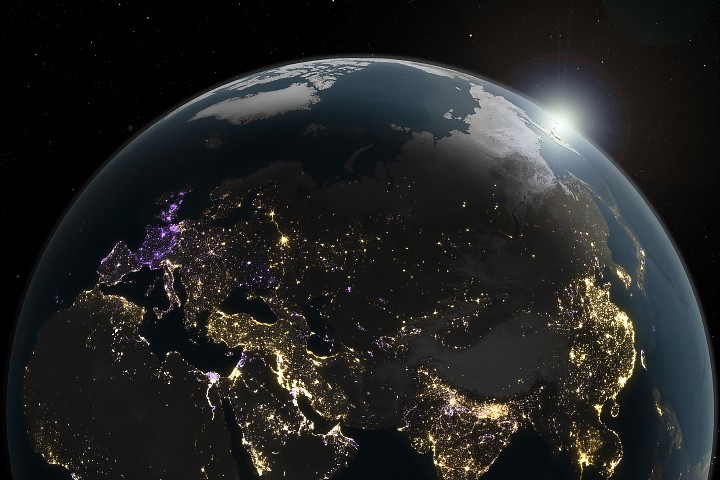
Recent maps developed from NASA’s Black Marble data illustrate significant transformations in artificial light across the globe. This analysis, examining changes from 2014 to 2022, demonstrates that instead of a steady increase, the brightness of nighttime environments fluctuates due to various socio-economic factors.
NASA’s Black Marble utilizes data from the VIIRS (Visible Infrared Imaging Radiometer Suite) on satellites like Suomi-NPP. These sensors capture nighttime light in a spectrum from green to near-infrared, enabling the identification of urban lighting, reflected moonlight, and auroras. The new map provides a detailed view of brightness changes worldwide, with specific colors indicating areas of increase (yellow/gold) and decrease (purple) in light levels.
The study found a notable global radiance increase of 34%. However, this overall surge obscures extensive dimming in several locations. For instance, while cities on the U.S. West Coast brightened due to population growth, parts of the East Coast became dimmer, attributed to the transition to energy-efficient LED lighting and economic changes.
Internationally, urban development in countries like China and northern India significantly contributed to rising nighttime brightness. Conversely, cities in Europe, particularly Paris, experienced marked reductions in light pollution—33% in France, 22% in the UK, and 21% in the Netherlands. These reductions coincide with the implementation of energy conservation strategies and the ongoing effects of the Russia-Ukraine conflict, which led to sharp dimming across Europe in 2022.
The visual representations include intricate artistic designs such as simulated sunlight and shadows while remaining true to the scientific data. The maps were recently featured on the cover of ‘Nature,’ illustrating the substantial insights gained from this research.
For those interested, larger versions of these maps and animations illustrating annual changes in nighttime lights during the study period are available for download from NASA’s Scientific Visualization Studio, providing valuable resources for understanding light pollution and environmental changes.
The results from this study bring attention to the dynamic nature of artificial lighting and its implications for both urban development and conservation efforts, underlining the need for continued monitoring of nighttime illumination trends.
The content above is a summary. For more details, see the source article.